| Description |
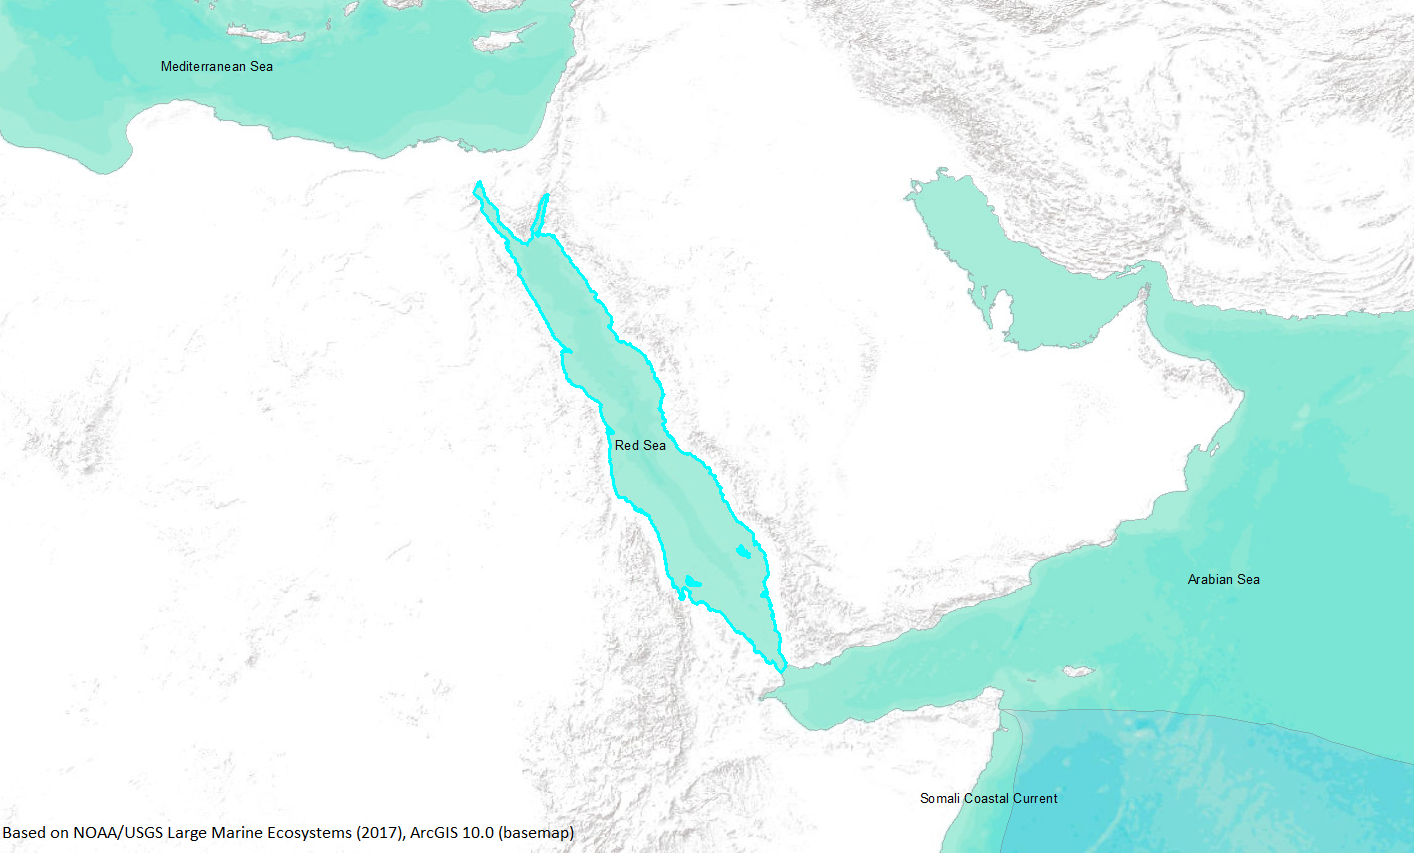
The Red Sea is a semi-enclosed tropical body of water adjacent to the Mediterranean Sea to the North and the Indian Ocean to the South (Getahun, 1998). It is a 200 kilometer long basin which extends from 12 degrees 40 minutes north at Bab-el-Mandeb to 30 degrees north at Suez. Its width is 30 kilometers at Bab-el-Mandeb to 280 kilometers at the Ethiopian and Yemen coasts. In the North, the Red Sea ecosystem ends with the Gulf of Aqaba to the East and the Gulf of Suez to the West. It is separated to the South from the Indian Ocean by a sill just north of Bab-el-Mandeb (Getahun, 1998). Geologically, it is relatively new compared with the Indian Ocean and the Mediterranean Sea. The Red Sea was formed by the expansion of the Mediterranean Sea (Getahun, 1998). The temperature and salinity increases during the summer to as high as 30 degrees Celsius and 41 ppt (parts per thousand), respectively. Consequently, there is no seasonal mixing of surface and deep waters, which has nutrient supply implications. The surface currents in the winter flow from the Gulf of Aden into the Red Sea and reverse in the summer. The bottom and mid-level currents, which are high in nutrients, flow in the opposite direction. This produces a net outflow of nutrients from the Red Sea in the winter and enrichment in the summer (Beckmann, 1984). The Red Sea ecosystem's heat flow characteristics are two to three times the world average, which indicates a temperature gradient in the bottom sediment. From November to May the temperature range is 21-23 degrees Celsius, and from July to October the range is 16-17.5 degrees Celsius. Salinity during November to May ranges from 38.5-39 ppt, and 36-36.5 ppt from July to October. Dissolved oxygen similarly decreases in the winter, from 1.6-2.3mL/L in the summer to 0.4-0.9mL/L in the winter (Seriy, 1968) (http://www.na.nmfs.gov/lme/text/lme33.htm). |
